RGP outputs
RGP
The regions_of_genomic_plasticity.tsv is a tsv file that lists all the detected Regions of Genome Plasticity. This
requires to have run the RGP detection analysis by either using the panrgp command or the rgp command.
It can be written with the following command:
ppanggolin write_pangenome -p pangenome.h5 --regions -o rgp_outputs
The file has the following format :
Column |
Description |
|---|---|
region |
A unique identifier for the region. This is usually built from the contig it is on, with a number after it. |
genome |
The genome it is in. This is the genome name provided by the user. |
contig |
Name of the contig |
genes |
The number of genes included in the RGP. |
first_gene |
Name of the first gene of the region |
last_gene |
Name of the last gene of the region |
start |
The start position of the RGP in the contig. |
stop |
The stop position of the RGP in the contig. |
length |
The length of the RGP in nucleotide |
coordinates |
The coordinates of the region. If the region overlap the contig edges will be right with join coordinates syntax (i.e 1523..1758,1..57) |
score |
Score of the RGP. |
contigBorder |
This is a boolean column. If the RGP is on a contig border it will be True, otherwise, it will be False. This often can indicate that, if an RGP is on a contig border it is probably not complete. |
wholeContig |
This is a boolean column. If the RGP is an entire contig, it will be True, and False otherwise. If a RGP is an entire contig it can possibly be a plasmid, a region flanked with repeat sequences or a contaminant. |
RGP to gene families
The rgp_families.tsv is a TSV file that maps each RGP to its gene family content.
It can be written with the following command:
ppanggolin write_pangenome -p pangenome.h5 --regions_families -o rgp_outputs
Column |
Description |
|---|---|
rgp_id |
The RGP identifier (found in ‘region’ column of |
family_id |
The gene family identifier present in the RGP. |
Spots
The spots.tsv is a tsv file that links the spots in summarize_spots.tsv with the RGPs
in regions_of_genomic_plasticity.tsv.
It can be created with the following command:
ppanggolin write_pangenome -p pangenome.h5 --spots -o rgp_outputs
Column |
Description |
|---|---|
spot_id |
The spot identifier (found in the ‘spot’ column of |
rgp_id |
The RGP identifier (found in ‘region’ column of |
Summarize spots
The summarize_spots.tsv file is a tsv file that will associate each spot with multiple metrics that can indicate the
dynamic of the spot.
It can be created with the following command:
ppanggolin write_pangenome -p pangenome.h5 --spots -o rgp_outputs
Column |
Description |
|---|---|
spot |
The spot identifier. It is unique in the pangenome. |
nb_rgp |
The number of RGPs present in the spot. |
nb_families |
The number of different gene families that are found in the spot. |
nb_unique_family_sets |
The number of RGPs with different gene family content. If two RGPs are identical, they will be counted only once. The difference between this number and the one provided in ‘nb_rgp’ can be a strong indicator on whether their is a high turnover in gene content in this area or not. |
mean_nb_genes |
The mean number of genes on RGPs in the spot. |
stdev_nb_genes |
The standard deviation of the number of genes in the spot. |
max_nb_genes |
The longest RGP in number of genes of the spot. |
min_nb_genes |
The shortest RGP in number of genes of the spot. |
Borders
Each spot has at least one set of gene families bordering them. To write the list of gene families bordering spots, you
can use the --borders option as follow:
ppanggolin write_pangenome -p pangenome.h5 --borders -o rgp_outputs
It will write a .tsv file with 4 columns:
Column |
Description |
|---|---|
spot_id |
The spot identifier. It is unique in the pangenome. |
number |
The number of RGPs present in the spot that have those bordering genes. |
border1 |
Comma-separated list of gene families of the 1st border. |
border2 |
Comma-separated list of gene families of the 2nd border. |
Since there can be some variation in the borders, some spots will have multiple borders and thus multiple lines in this file. The sum of the number for each spot_id should be exactly the number of RGPs in the spot.
In addition, the --borders option also generates a file named border_protein_genes.fasta, containing protein
sequences corresponding to the gene families of the spot borders.
Draw spots
The draw command with the option --draw_spots can draw specific spots of interest, whose ID are provided, or all the
spots if you wish.
It will also write a gexf file, which corresponds to the gene families and their organization within the spots. It is
basically a subgraph of the pangenome, consisting of the spot itself.
The command can be used as such:
ppanggolin draw -p pangenome.h5 --draw_spots --spots all
This command draws an interactive .html figure and a .gexf graph file for all the spots.
If you are interested in only a single spot, you can use its identifier to draw it. For example for the spot_34:
ppanggolin draw -p pangenome.h5 --draw_spots --spots spot_34
The interactive figures that are drawn look like this:
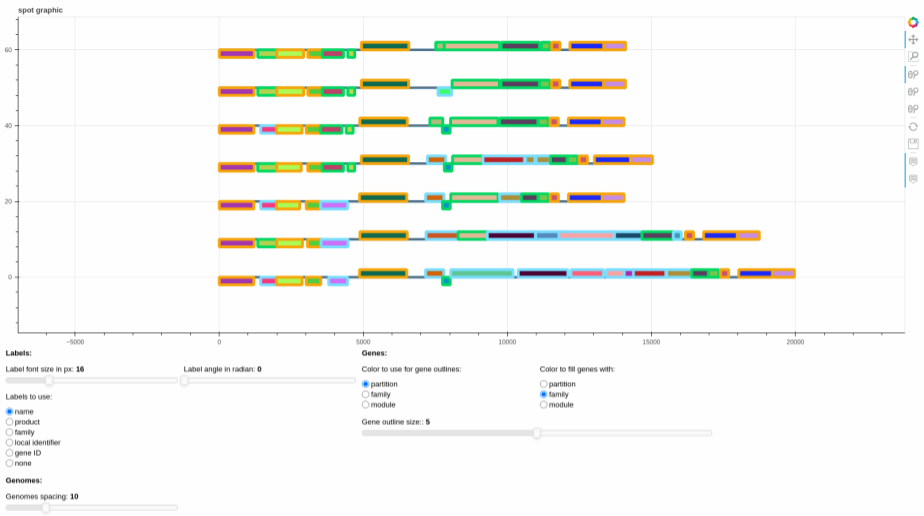
The plot represents the different gene organizations that are found in the spot. If there are RGPs with identical gene
organization, the organization is represented only once (the represented RGP is picked at random among all identical
RGPs). The list of RGPs with the same organization is accessible in the file written alongside the figure
called spot_X_identical_rgps.tsv, with X the spot_id.
They can be edited using the sliders and the radio buttons, to change various graphical parameters, and then the plot itself can be saved using the save button on the right of the screen, if need be.
For the gexf file, you can see how to visualize it in the section about the pangenome gexf.